Investigating a Hidden Data Inconsistency in TerraMesh: The Sentinel-2 Baseline Processing Shift
When working with large-scale satellite imagery datasets for machine learning, the details of data preprocessing can impact downstream model performance. For a current project, I am using the TerraMesh dataset, where I discovered a subtle but significant data inconsistency related to Sentinel-2 imagery that I would like to document.
Background: TerraMesh and TerraMind
TerraMesh is a large-scale multimodal dataset designed for pretraining geospatial foundation models. It contains over 9 million aligned samples spanning multiple Earth observation modalities, including Sentinel-2 L2A surface reflectance imagery. The dataset serves as the pretraining corpus for TerraMind, a multimodal foundation model for both generative and discriminative downstream remote sensing tasks.
Sentinel-2, operated by the European Space Agency (ESA), is arguably the most important freely available satellite imagery source for Earth observation applications. Its 13 spectral bands, 10-meter resolution, and 5-day revisit time make it invaluable for applications ranging from agriculture monitoring to disaster response.
The Sentinel-2 Processing Baseline Change
On January 25, 2022, ESA deployed Processing Baseline 04.00 for Sentinel-2 products. This update introduced a critical change: to enable representation of negative reflectance values (which can occur due to atmospheric overcorrection), ESA shifted the dynamic range of digital numbers (DN) by adding a constant offset (approximately -1000) to all bands. This means that post-January 2022 imagery has systematically different pixel values than pre-2022 imagery, even for identical ground conditions.
The TerraMesh paper states that “the +1000 offset is removed from post-2022 data” and reports a value range of [0, 10000] for S2L2A. However, using the currently available data on Hugginface, there seem to be inconsistencies that I did not find reported anywhere.
Downn the rabbit hole
What lead me to investigate the data normalization more carefully was two things:
- Observing regularly occuring fluctuation loss patterns that might be due to inconsistent statistics
- Unexpected worse downstream performance on a different dataset with Sentinel 2 data
The TerraMesh Huggingface repo provides dataset statistics for z-score normalization here, which I assume are the ones used for training the TerraMind model.
Data Collection
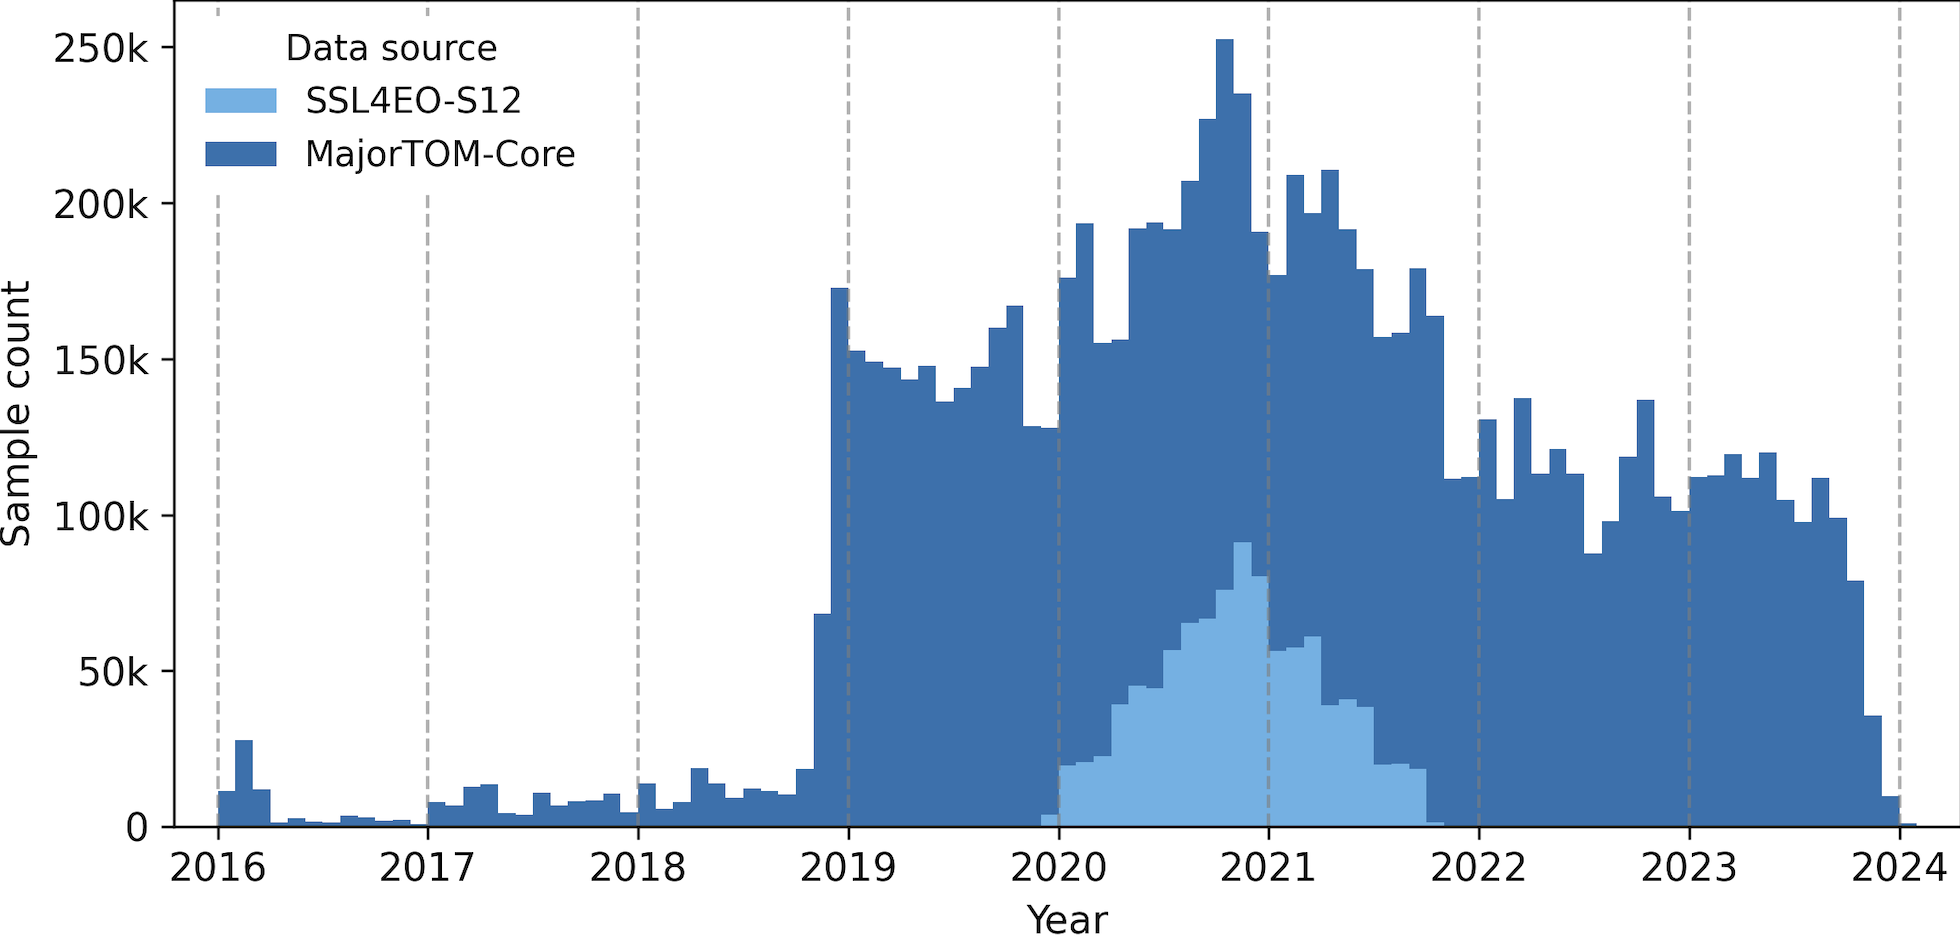
The plot below is from the TerraMesh Huggingface showing the distribution of samples across time. So a majority of data comes from the pre date January 24,2022.
Channel Histograms
Examining the raw pixel value distributions across all channels is what got me first curious:
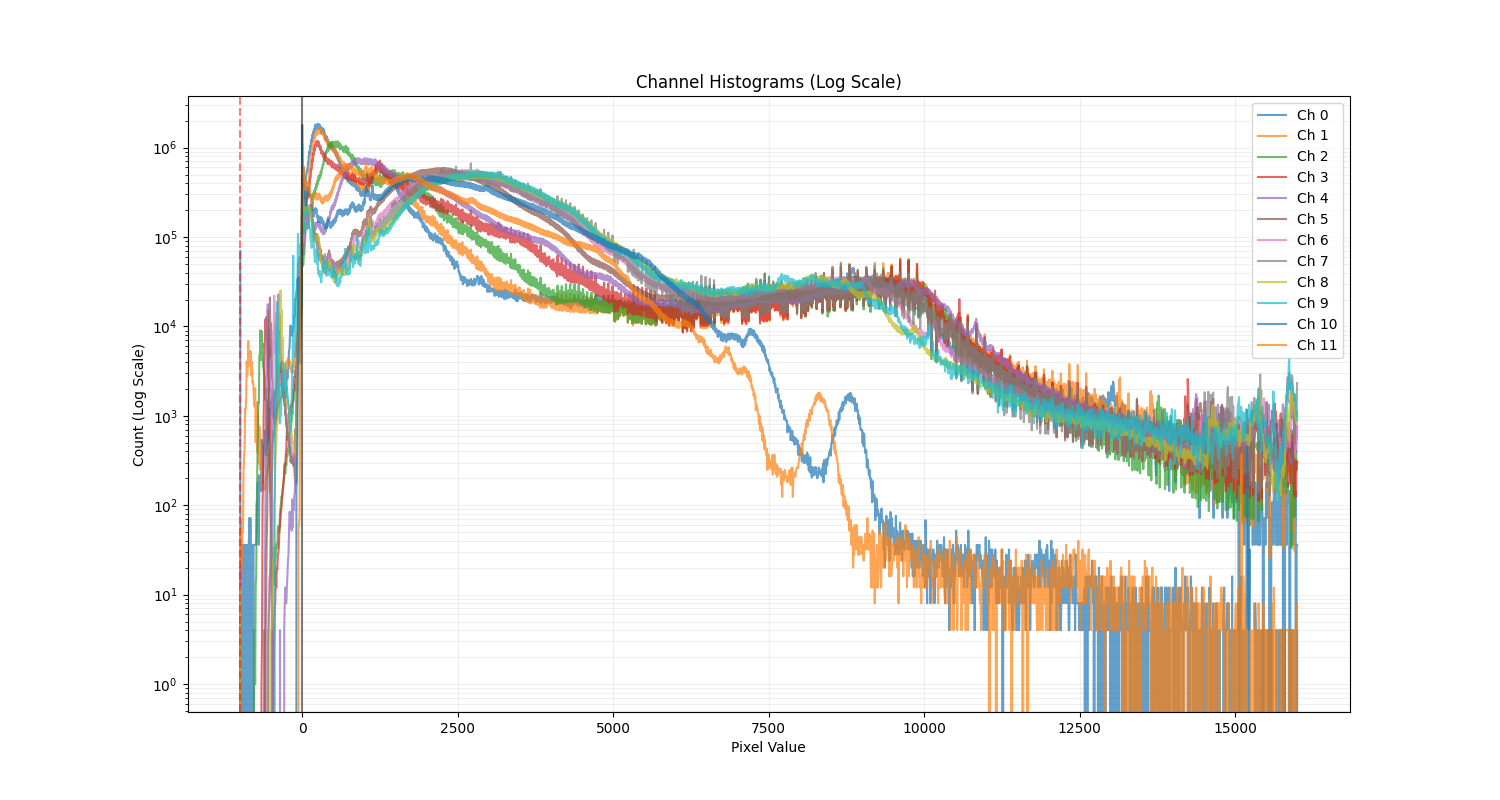
The histogram shows significant density in negative values, with a clear spike around -1000 corresponding to NoData pixels in post-baseline imagery. The histogram contradicts the reported [0, 10000] data range in Table 2 of the TerraMesh paper.
Temporal Analysis of Minimum Values
While I did not find any information on the Hugginface or Github repos about the normalization scheme, the updated arxiv paper stated that “the +1000 offset is removed from post-2022 data”, which is a bit ambiguous. To check whether, there was a clear difference between pre and post January 24 2022 data, I plotted the minimum pixel values across TerraMesh samples (first 25 training shards and all validation shards) against their acquisition timestamps, with subsampling to not overcrowd the plot.
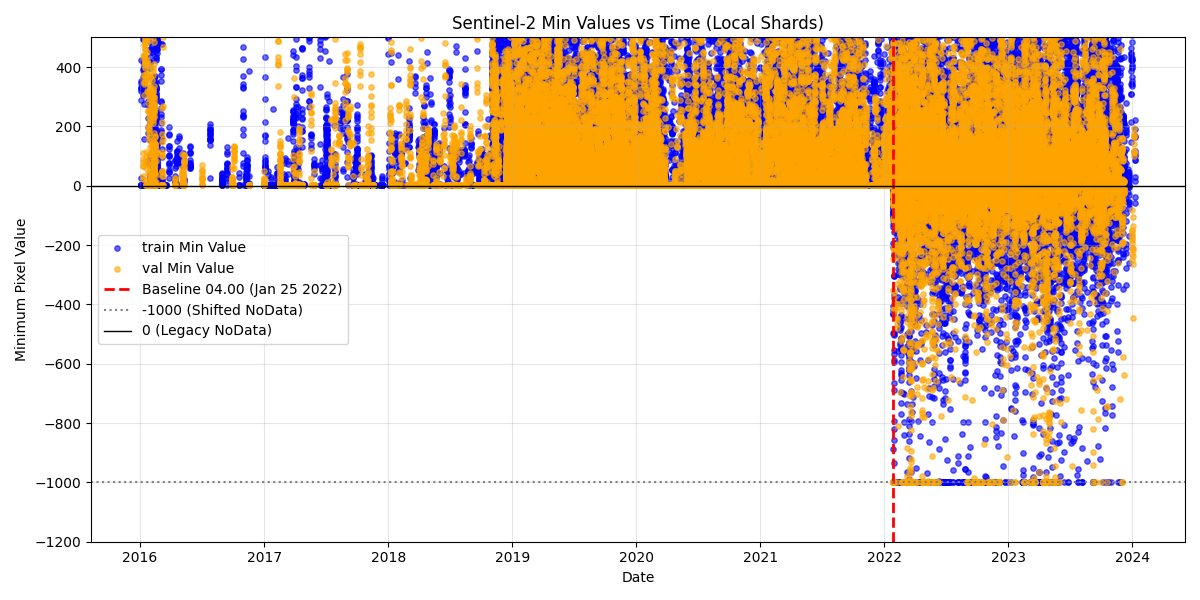
The scatter plot reveals the sharp transition on January 24, 2022. Pre-baseline data shows minimum values clustered around 0 (the expected NoData value), while post-baseline data shows minimum values between up to -1000. The Google Earth Engine catalog states that “The offset affects data after January 24th 2022; removing the offset puts these data in spectral alignment with pre-04.00 baseline data.” This implies that the TerraMesh data is not aligned, and it appears that the provided z-score statistics are just computed over the collection as is.
Statistical Analysis
Computing separate statistics for pre- and post-baseline samples reveals systematic differences across channels of Pre and Post.
| Channel | Pre Mean | Post Mean | Pre Min | Post Min | Pre Std | Post Std | Diff (Mean) |
|---|---|---|---|---|---|---|---|
| B01 | 2722.7 | 1756.5 | 635.0 | 619.0 | 1746.1 | 1421.3 | -966.2 |
| B02 | 2501.4 | 1548.4 | 1.0 | -542.0 | 1794.7 | 1490.4 | -953.0 |
| B03 | 2370.2 | 1466.1 | 146.0 | -209.0 | 1655.9 | 1415.4 | -904.2 |
| B04 | 2444.1 | 1505.8 | 1.0 | -96.0 | 1932.4 | 1656.1 | -938.3 |
| B05 | 2660.2 | 1723.3 | 1.0 | -480.0 | 1921.2 | 1625.7 | -936.9 |
| B06 | 3209.0 | 2323.1 | 1.0 | -423.0 | 1816.5 | 1526.4 | -885.9 |
| B07 | 3468.7 | 2608.3 | 2.0 | -474.0 | 1798.9 | 1523.8 | -860.5 |
| B08 | 3385.8 | 2528.2 | 1.0 | -24.0 | 1739.3 | 1471.5 | -857.5 |
| B8A | 3649.9 | 2801.1 | 1.0 | -698.0 | 1778.5 | 1516.6 | -848.8 |
| B09 | 1799.9 | 968.0 | 8.0 | -19.0 | 1053.0 | 873.7 | -831.9 |
| B11 | 791.8 | 37.9 | 1.0 | -9.0 | 442.8 | 103.2 | -753.9 |
| B12 | 2739.2 | 2016.9 | 1.0 | -46.0 | 1312.8 | 1215.8 | -722.3 |
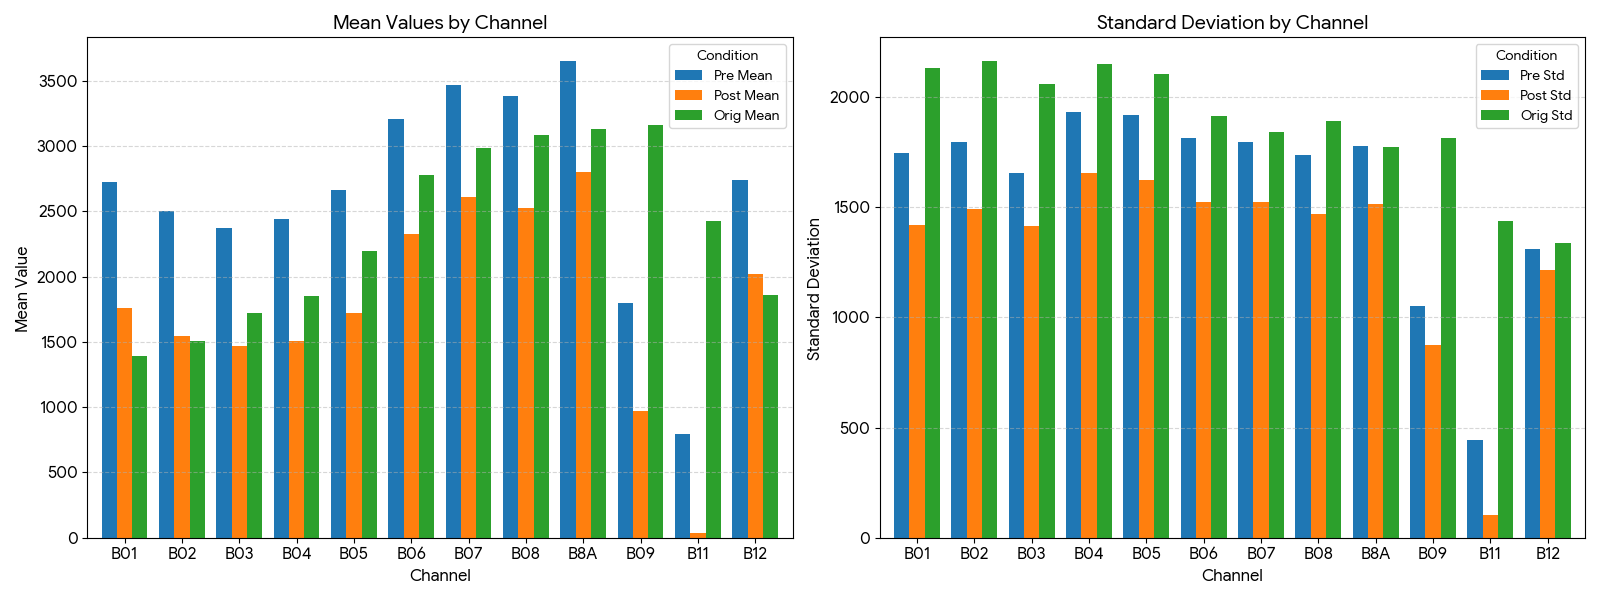
These differences closely match the expected ~1000 offset, confirming that the two data populations have not been harmonized.
The bar plot visualizes these difference, for the pre date (blue), post date(orange), and the original provided statistics (green).
Implications for Normalization
TerraMesh provides precomputed z-score normalization statistics (mean and standard deviation per channel). When these statistics are computed across a mixed population of harmonized and unharmonized data, the resulting normalization can become problematic, because trained models will have a certain expectation of value ranges for downstream tasks, especially with frozen evaluation.
The Possible Covariate Shift Problem
This inconsistency creates a covariate shift problem with real implications for downstream applications. Foundation models like TerraMind, pretrained on TerraMesh, learn feature representations and latent tokens from data spanning both conventions. When these models are applied to downstream tasks using Sentinel-2 data processed with a single, consistent convention (as is standard practice), performance may degrade.
Research on transfer learning in remote sensing has consistently shown that domain shift—arising from variations in data collection conditions—can significantly hamper generalization. Work like Corley et al. 2024 has demonstrated that correct normalization statistic alignment for pretrained ImageNet models can make a substantial performance difference. If the pretraining data itself contains internal inconsistencies, the learned representations may be suboptimal.
A Proposed Fix: Harmonization / New Z-Score statistics
To address this issue, I implemented time-aware harmonization that:
- Applies +1000 offset to samples with timestamps on or after January 24, 2022
- Clips values to [0, 10000] to handle saturation and maintain physical plausibility
- Recomputes normalization statistics on the harmonized data
The same procedure can then be used to normalize the S2L2A modality data when training with TerraMesh dataset.
Broader Implications
For TerraMind Users
Models pretrained on TerraMesh that just use the existing normalization stats may have learned representations that implicitly encode the baseline discontinuity. When fine-tuning or evaluating on downstream datasets that use consistently processed Sentinel-2 data (such as data from Google Earth Engine’s harmonized collections), there may be a distribution mismatch.
I hypothesize that:
- Performance on downstream tasks using pre-2022 imagery may differ from post-2022 imagery
- Fine-tuning with unharmonized data may yield suboptimal results if the pretrained representations expect the mixed distribution
Conclusion
Large-scale dataset curation is challenging, and subtle issues like processing baseline changes can be overlooked. We provide a concrete fix (time-aware harmonization) for those who wish to try this and highlight the importance of data deep dives when working with complex multi-year satellite imagery datasets.
Enjoy Reading This Article?
Here are some more articles you might like to read next: